Engage with data through interactive visuals that helps breakthrough decision making.
Interactive visuals for Impactful Insights.
Unleash the Power of Visual Analytics
Opportunity: Align your organization for success by filtering out noise and conquering complex issues with proven knowledge enablement tools.
Power BI
Connect to and visualize any data using Microsoft Power BI, the unified, scalable platform for self-service and enterprise business intelligence
Tableau
A visual analytics platform transforming the way we use data to solve problems—empowering people and organizations to make the most of their data
ESRI ArcGIS
ArcGIS gives you everything you need to manage and extract answers from imagery and remotely sensed data
Intelligent Data Visualization
Data is not useful if we cannot get information out of it. Logic Intelligence can help decision making process easier by providing intelligent insights into the process.
The art of data visualization
Data Viz is story telling by highlighting the information that is important to the company and making the decision process easier.
Converting data to information
Weaving the data together so that it makes sense across the business units.
Getting information from your data
Once the data is collected, the next step is to derive the stories to get information the data is providing.
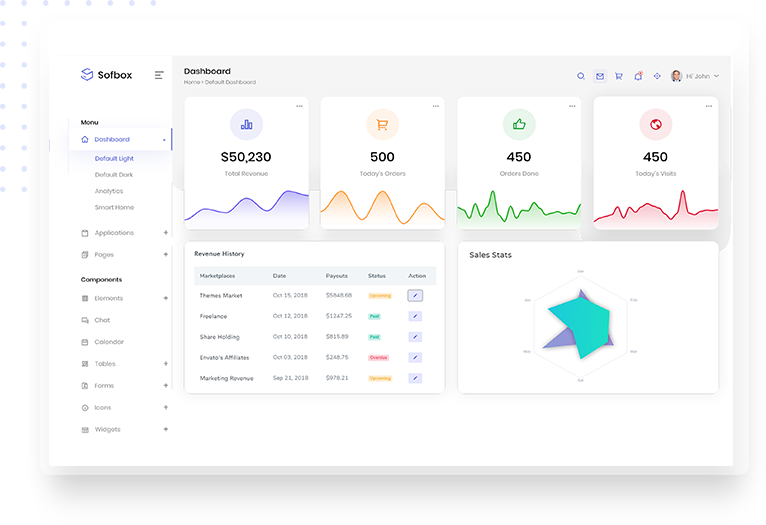
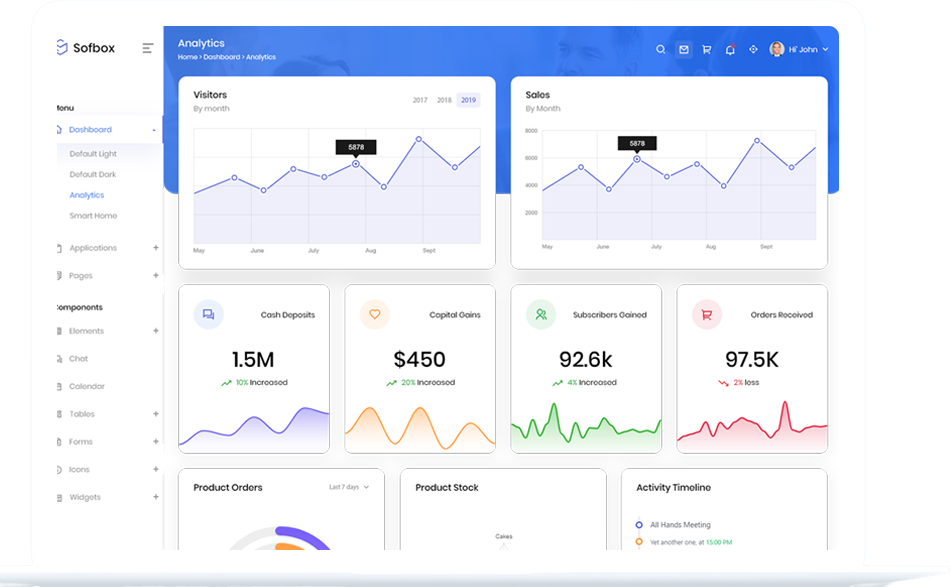
Dashboards
A dashboard is a visual interface displaying key metrics and data points. It provides at-a-glance insights, facilitating informed decision-making and efficient performance monitoring.
Geographic Information System (GIS)
A Geographic Information System (GIS) is a powerful tool for capturing, analyzing, and visualizing spatial data, enabling informed decision-making and effective management of geographical information.
Data Explorer Reports (Data Models)
Data Explorer Reports (Data Models) transform raw data into insightful visualizations, enabling users to uncover trends, make informed decisions, and drive business growth through advanced analytics.
Self-service BI
Self-service BI empowers users to analyze and visualize data independently, without IT assistance, fostering quick insights, informed decisions, and enhanced business agility through intuitive tools.